21 Nov History: A Year for the Books
Few images evoke the despair of the Great Depression more poignantly than photographs of the enormous dust storms that defined the Dust Bowl era. Frequently described as “black blizzards,” these airborne tsunamis were primarily caused by successive droughts, the most significant of which occurred in 1934, and wind erosion, the effects of which were magnified by mechanized plowing of the short-grass plains. One of the most widespread manifestations of the 1934 drought was a dust storm that originated in Montana and Wyoming. Over the course of four days, from May 9 through 12, 1934, westerlies transported topsoil from Big Sky Country across the Dakotas to points from Chicago to Atlanta and, then, to the eastern seaboard before dusting the decks of ships 300 miles off the Atlantic Coast.

During the Great Depression, the combination of successive droughts and repeated grasshopper infestations wreaked enormous environmental and economic devastation on the short-grass plains of Montana. Few contemporary writers conveyed the omnipresence of these ravenous, winged hordes more succinctly than Ernie Pyle. Best known for his distinguished service as a war correspondent during World War II, Pyle traveled through Montana in 1936, where he learned that “the grasshopper opened and closed every conversation.” | LIBRARY OF CONGRESS
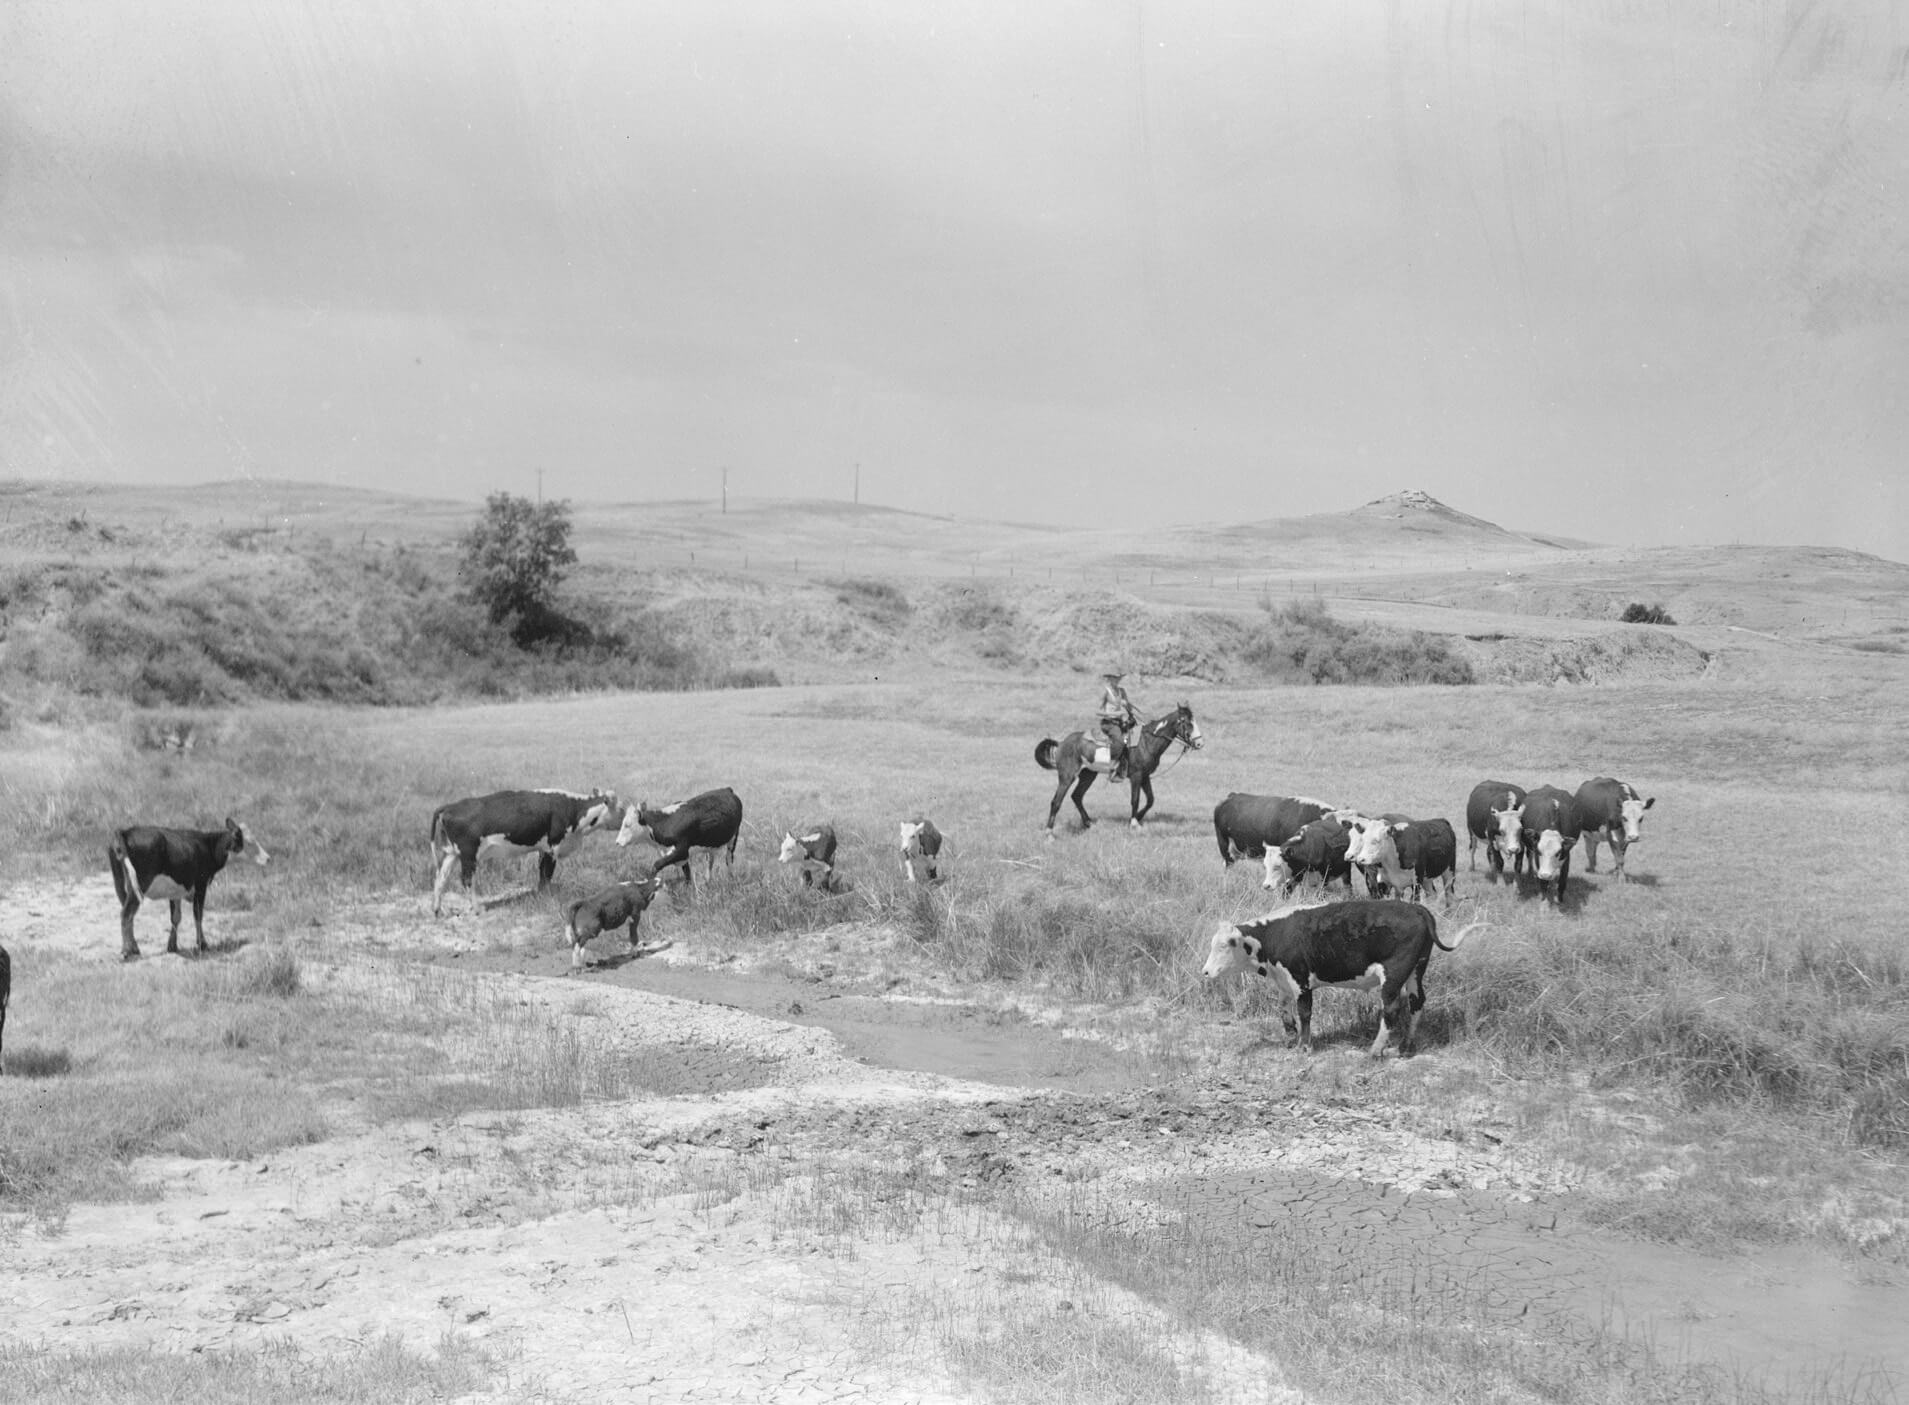
For farmers who struggled to eke out a living on the short-grass plains, the combination of successive droughts, exacerbated by severe and repeated infestations of grasshoppers and Mormon crickets, posed a daunting challenge. Mary Murphy, author of Hope in Hard Times: New Deal Photographs of Montana, 1936–1942, observes that settlers in eastern Montana, particularly those well-versed in Scripture, may have regarded their plight as eerily similar to plagues referenced in the Old Testament and the apocalyptic imagery described in the Book of Revelation. As the transition from fall 1935 to winter unfolded, weather conditions would, indeed, test the proverbial patience of Job.
Harbingers of an extraordinarily severe winter initially assumed the form of flanking maneuvers by Old Man Winter to Montana’s east and west. Statewide average temperatures for November 1935 in North Dakota (16.4 degrees Fahrenheit) and Idaho (26 F) rank respectively as their seventh and fourth coldest Novembers in the last 130 years. The following month, winter’s tentacles extended unusually deep into the southeastern United States, where Georgia and South Carolina experienced their coldest Decembers on record. By Montana’s standards, however, the month was uncharacteristically mild, a phenomenon that meteorologist Mark Vogan attributes to significant Chinook wind activity.
The first eight months of 1936 established a multitude of local and state records in Montana, across the Northern Plains, and throughout much of the nation. Corroborating data, unless otherwise stipulated, is provided by the National Centers for Environmental Information (NCEI) at ncei.noaa.gov.
Most notably, temperatures for the contiguous United States averaged 25.23 degrees in February and 76.77 degrees in July, which remain the coldest and hottest temperatures on record for those months. Christopher Burt, a weather blogger for wunderground.com, also notes that the “summer of 1936 (June–August) remains the warmest in U.S. records.” On the other hand, the meteorological winter of 1935–1936 (December–February) is “still the coldest winter on record for the Northern Plains states and second-coldest winter for the entire contiguous U.S.”
For Montanans who experienced this historic cold wave, their memories were, perhaps, heightened by comparison to conditions that were prevalent only 12 months prior. The statewide average temperature for February 1935 was 27.3 F. By contrast, the prolonged surge of bitterly cold Arctic air that invaded Big Sky Country during February 1936 generated a record-shattering average temperature of minus 3.9 degrees, the coldest month ever recorded in Montana. The difference between statewide averages for the same month in successive years was an astounding 31.2 degrees.
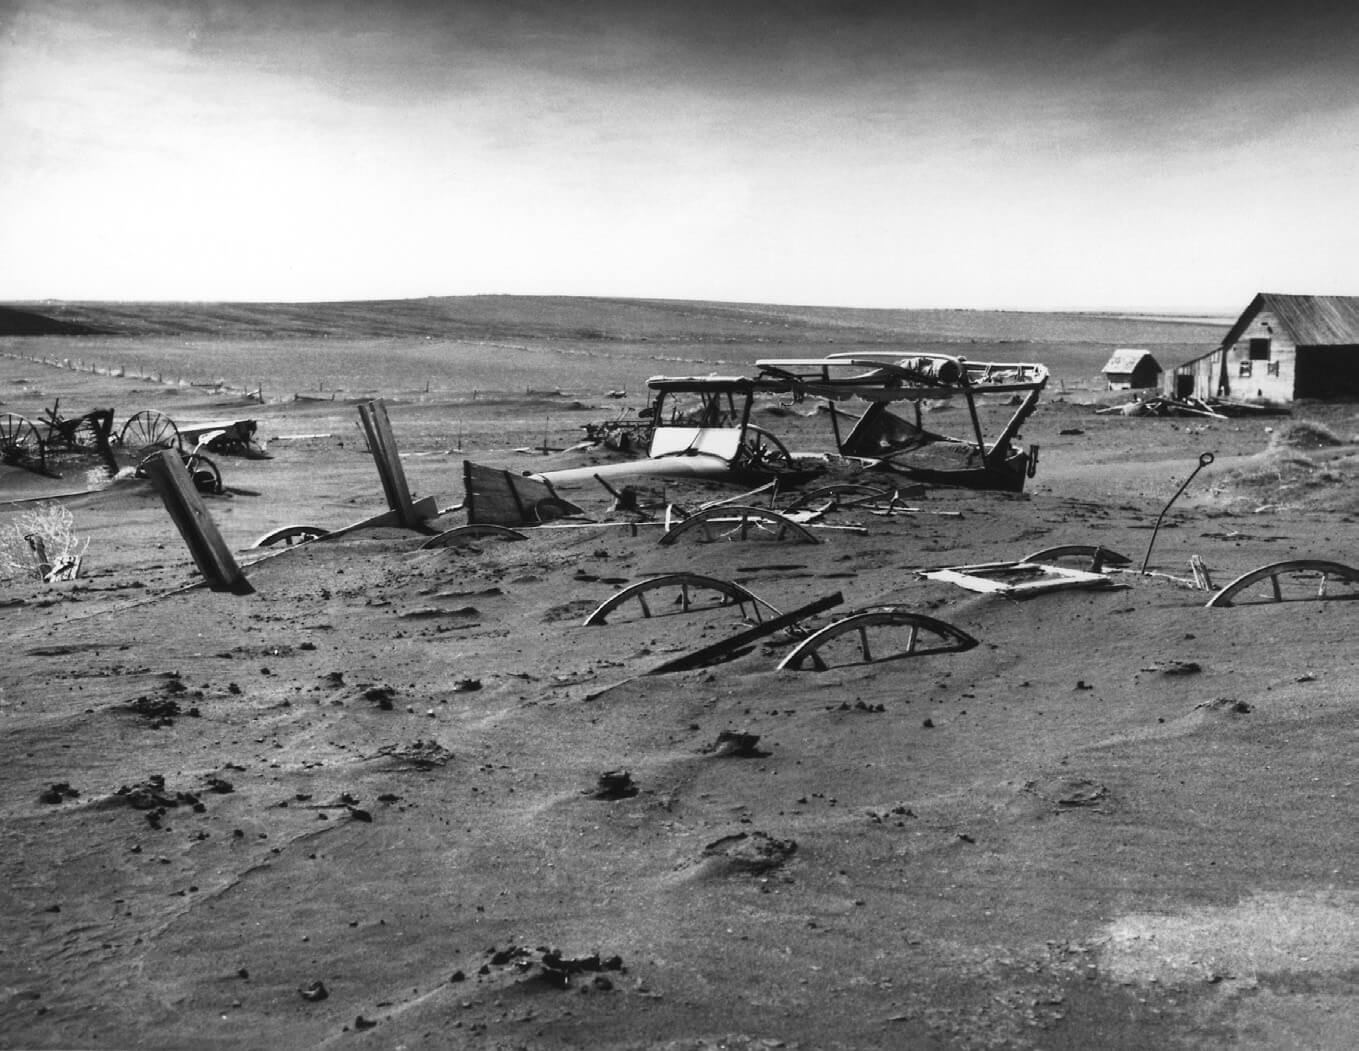
This image superbly symbolizes wrecked livelihoods — the microcosmic manifestation of damage caused by dust storms, which remain the meteorological icon for the Great Depression. Montana and the Dakotas were significantly impacted by dust storms, particularly from 1934 to 1936, but the true epicenter of the Dust Bowl circumscribed the panhandles of Texas and Oklahoma, plus adjoining portions of New Mexico, Colorado, and Kansas. | UNITED STATES DEPARTMENT OF AGRICULTURE
A more sharply delineated picture of conditions that existed in 1936 would probably emerge if one could neatly segregate data recorded at observational stations east of the Continental Divide, which typically report colder winter temperatures, from those located west of the divide. This assertion is supported by data from geographers Rick and Susie Graetz, who indicate that “many areas of Montana east of the mountains recorded below zero readings for 57 days straight” that winter. Furthermore, Glasgow’s average temperature for February 1936 (minus 15.8 F) is much closer to the statewide average of North Dakota (minus 14.1 F) than the figure previously cited for Montana.
The cold wave of 1936 peaked in mid-February. At least 16 observational stations in Montana posted temperatures of minus 50 F (or below) on one or more days between February 14 and 16. The coldest temperatures, minus 59 F, were reported in Glasgow and Frazer on February 15, with readings of minus 58 F observed at Jordan and Medicine Lake on February 14 and 16, respectively. It is difficult to crown one site as the coldest of the cold, but Frazer and Glasgow are leading contenders for that dubious distinction. Both stations registered overnight lows of minus 54 F (or below) on three consecutive days during this period. Interestingly, Frazer’s highest temperature on February 16 was minus 35 F, which approaches the record established by Glasgow on January 12, 1916, for the “coldest maximum temperature [minus 44 F] ever recorded in the Lower 48,” a distinction raised by Burt in his book, Extreme Weather: A Guide and Record Book.
Documentation for major snowstorms in Montana during this cold wave is, with one notable exception, difficult to find. This anomaly may simply confirm that extremely cold air is rarely accompanied by significant moisture. Nevertheless, Missoula received its largest single-day snowfall — 19.7 inches — on February 12, 1936.
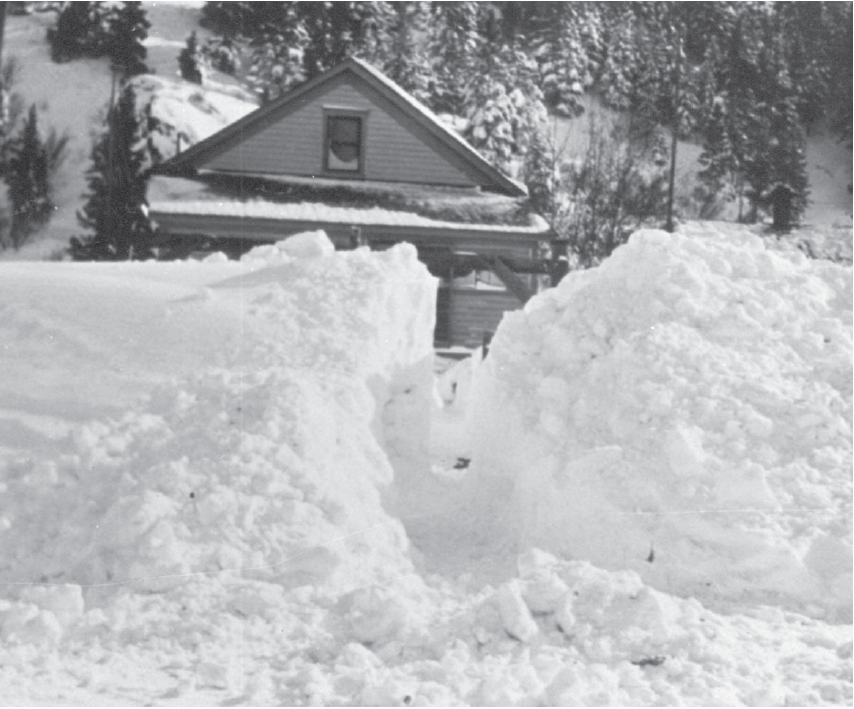
Surprisingly few photographs, if any, survive as documentation for Missoula’s all-time record snowstorm, which dumped 19.6 inches of snow on February 12, 1936 and, over three days (February 11–13), a total of 28.5 inches. Dave Noble, a meteorologist for the National Weather Service in Missoula, regards this event as the product of “an anomalous plume of moisture, possibly an atmospheric river, overrunning the Arctic air already in place.” This interpretation, he adds, is strongly supported by precipitation records for February 12, which illustrate a pattern of heavy snowfall, one that extended from the Sierras to the Northern Rockies, with “up to 30 inches [reported] in the Flathead [Valley]” and, far to the east, 13 inches in Billings. | ARCHIVES AND SPECIAL COLLECTIONS, MANSFIELD LIBRARY, UNIVERSITY OF MONTANA
Localized manifestations of this weather pattern generated even more astonishing data. Parshall, North Dakota set the state’s all-time record low, minus 60 F, on February 15, 1936. In Extreme Weather, Burt states that the town of Langdon, located near the Canadian border, reported subzero overnight lows on 67 consecutive days. During this period, temperatures remained below zero for 41 days straight, from January 11 to February 20, which marks the longest unbroken streak of its kind in U.S. history outside of Alaska. Furthermore, Burt emphasizes that Turtle Lake, North Dakota experienced an average temperature of minus 19.4 degrees for February, which “constitutes the lowest monthly average ever recorded in the Lower 48.”
The onset of March granted reprieve to Montana, as evidenced by a more seasonally appropriate monthly average of 28.6 degrees. However, Old Man Winter would bid farewell with one final, intense burst of subzero weather. On March 30, temperatures plummeted to minus 20 F and minus 29 F at Red Lodge and Summit, respectively, which were followed by a minus 28 F reading at Chessman Reservoir on April Fool’s Day and minus 14 F at Pleasant Valley on April 3.
Barely two months later, a newspaper article signaled the onset of a heat wave and drought conditions in McCone County, Montana. According to the June 5 edition of the Circle Banner, the end of May had been “extremely hot with high winds.” Consequently, many early crops were already ruined for “lack of moisture.” The summer of 1936 would rival, if not surpass, the severity and scope of February’s brutal cold wave.
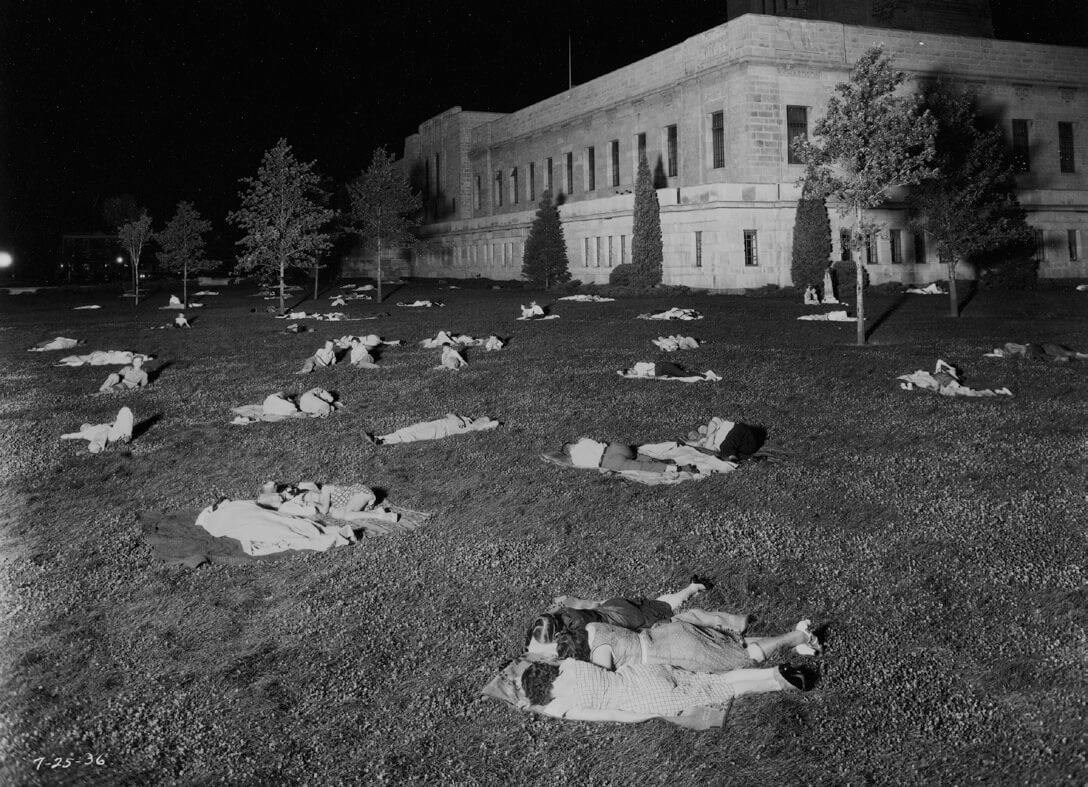
The relentless heat waves of 1936 occurred before air conditioning was widely accessible. Under those circumstances, Americans sought relief through any means available. An overnight minimum temperature of 91 F preceded sunrise on July 25, the day that Lincoln, Nebraska established its all-time record high of 115 F. This image poignantly conveys the misery and daunting challenge that people endured night after night during the peak of that record-breaking summer. | NEBRASKA STATE HISTORICAL SOCIETY
Two primary heat waves scorched the land, both of which clearly demonstrated progressive patterns of effect in the areas they impacted. The northern states, including Minnesota, bore the initial brunt of this historic heat wave, with Steele, North Dakota and Gann Valley, South Dakota posting all-time record highs of 121 F and 120 F on July 6 and 5, respectively. Locations in Maryland, New Jersey, Pennsylvania, and West Virginia then reported record temperatures of 109 to 112 F on July 10. Climatologist Eric Hunt and eight co-authors of the 2020 report, “The Flash Drought of 1936,” conclude that the July heat wave reached its peak by the latter date, at which time maximum temperatures greater than 100 degrees were reported, at minimum, in 30 states east of the Rocky Mountains. The footprint of this massive weather system extended from eastern Montana to upstate New York and Connecticut, then down along the eastern seaboard from New York City to Richmond, Virginia, and into the deep South, from Georgia to Mississippi.
By mid-July, the heat wave shifted to the western Corn Belt, followed by the Central Plains. According to Burt in Extreme Weather, “the average [maximum] temperature of all 113 stations in Iowa was 108.7 degrees” on July 15. Ten days later, Lincoln, Nebraska experienced a record high of 115 F, which was followed by an overnight low of 91 F, that Burt describes as, perhaps, “the hottest night ever recorded in the U.S. outside of the desert Southwest.” A photograph taken that night shows residents who, in their quest to obtain a modicum of relief, attempted to sleep on the lawn of the state capitol.
The second heat wave was more localized, primarily affecting the Southern Plains, portions of the lower Mississippi, and the south-central United States. It peaked in mid-August, with readings of 120 F registered at several sites in Oklahoma and Texas. Predictably, such stifling heat was accompanied by desiccating drought. However, the analysis of Hunt’s research team reveals that a widespread flash drought preceded the heat waves of 1936. By the first week of July, they estimate that “roughly 3 million square kilometers of the U.S. from the Front Range of the Rocky Mountains to the eastern Great Lakes and from the mid-South to the Canadian border were in drought or rapidly cascading into drought.” Tragically, more than 5,000 heat-related deaths occurred during the summer of 1936, which, according to Hunt and his colleagues, was the “largest weather-related mortality event” in the United States “since the Galveston hurricane in 1900.”
The blistering summer of 1936 set 12 state records for the highest temperatures recorded. Three additional states reported maximum temperatures that tied pre-existing records. In the subsequent 89 years, none of those records have been broken.
One of the most impressive statistical footnotes from 1936 pertains to temperature variances recorded at individual observation stations. With an all-time low of minus 58 F and a maximum temperature of 117 F, Medicine Lake, Montana holds the record (175 degrees) for the most extreme range of temperatures observed at any single site in the contiguous United States. Two sites in the Dakotas are tied for third nationally in this category, based solely on the array of temperatures reported there from mid-February to early July 1936. According to Burt, “Parshall, North Dakota saw a 172-degree spread (from minus 60 degrees to 112 degrees), as did McIntosh, South Dakota (minus 58 degrees to 114 degrees).” These enormous fluctuations mark the greatest temperature variance reported by any observational station in a calendar year.
The severity and protracted duration of extreme weather events that impacted vast swaths of the nation in 1936 set it apart, arguably, from any other year in the 20th century.
Douglas A. Schmittou is a freelance writer in Billings, Montana. His research focuses on travel in the Northern Rockies; evidence-based wellness protocols; and 19th century Plains Indian art, material culture, and ethnohistory. His work has appeared in Montana: The Magazine of Western History, Plains Anthropologist, and American Indian Quarterly.
No Comments